NIFTY is moving in channel.
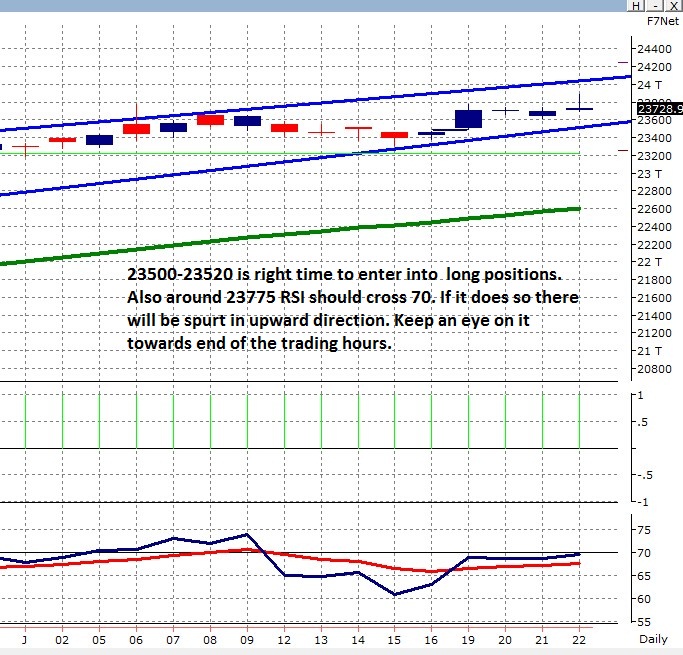
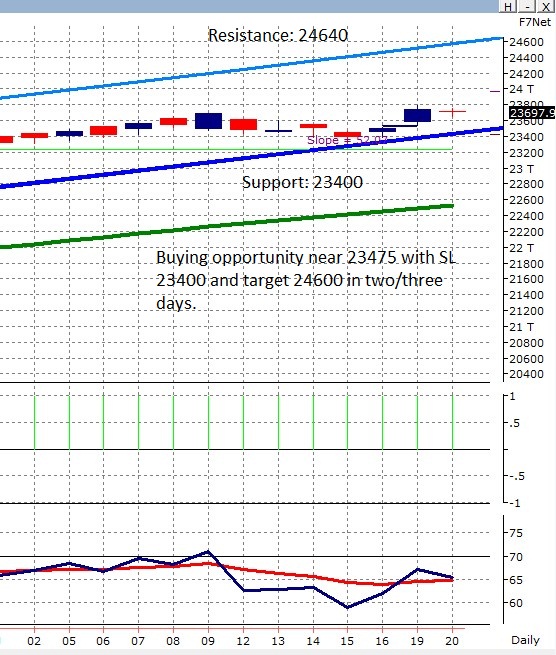
NIFTY daily chart
On daily chart since mid March it is moving in channel.
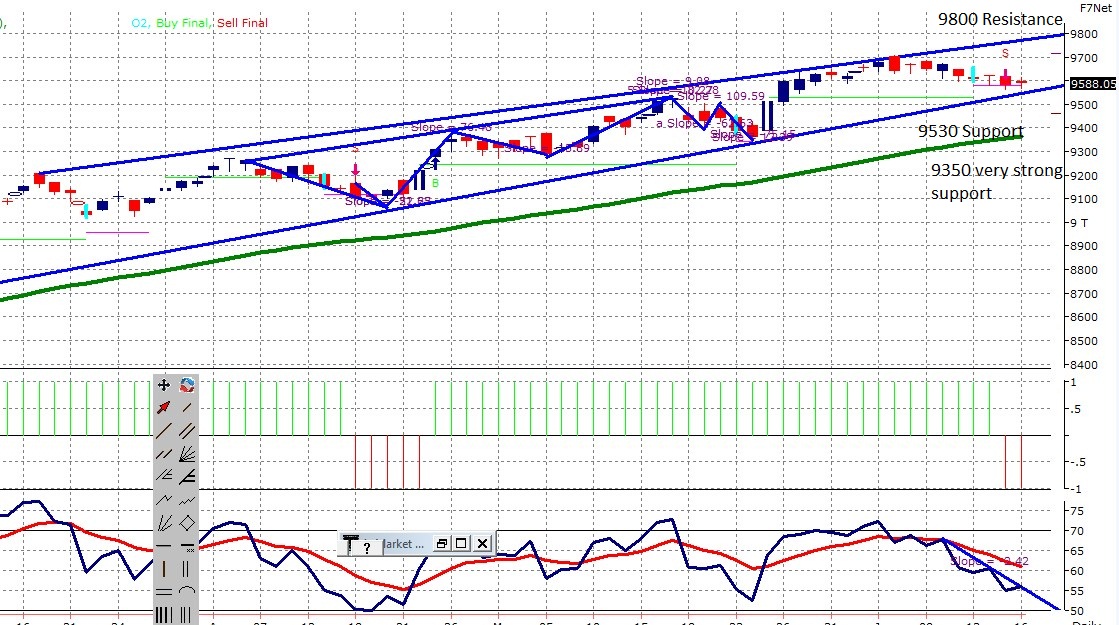
NIFTY is at near support, 9530, it will try to move towards 9800 during this week. One can hold NIFTY PUT sell contracts till NIFTY goes below 9530.
OTM PUT contracts like 9200, with one month view could be held till NIFTY takes plunge below 9350.
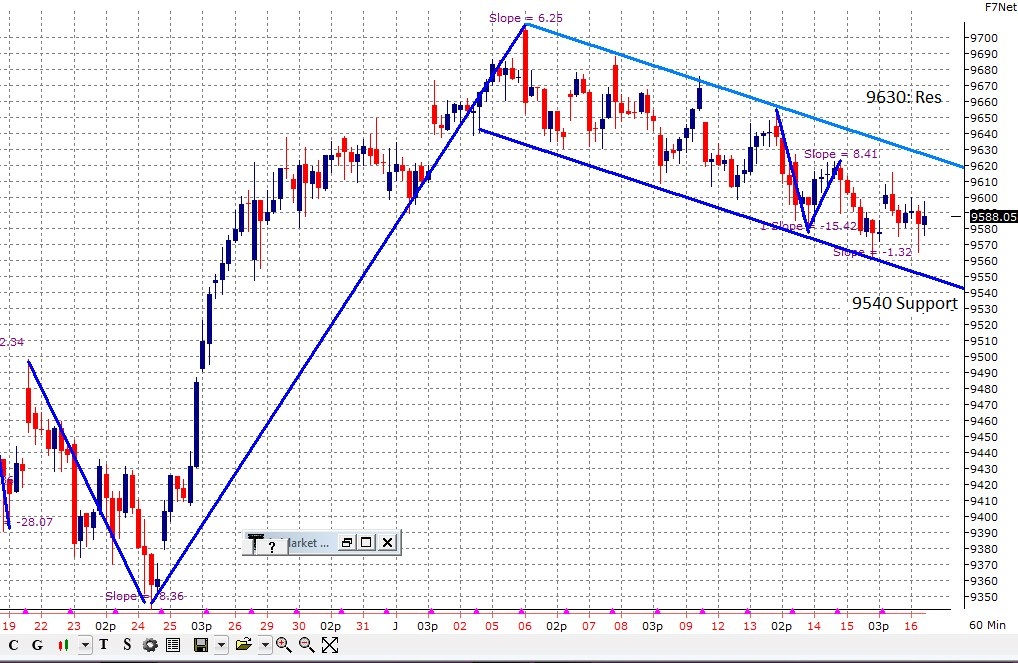
NIFTY Hourly Charts:
For last two weeks NIFTY is moving in small channel in Hourly chart too!
It also shows 9540 support and 9630 as resistance.
One can buy NIFTY Future when it would cross
9630 in SPOT. Or
Sell NIFTY PUTs
OI analysis
No great analysis of OI is required at the moment. It shows 9500 as support and 9700 as resistance.
Possible Trades in NIFTY:
1) Buy NIFTY 9700 CALLs if NIFTY crosses 9630 in SPOT.
2) Sell NIFTY 9600 CALLs if NIFTY goes below 9530.
Don't trade for huge profits and exit trades in 20-30 points profit.
Alternatively
3) Buy NIFTY 9600 CALL around 60 and Sell 9700 CALL around 22/-
Maximum loss about 5700 and maximum profit could be above 9500/-. Exit this trade if NIFTY goes below 9530 at EOD to minimize the loss.
Disclaimer: This blog does not take any responsibility of your profit/loss.


 Bank NIFTY Hourly